
A Socioeconomic view of Housing
- cornerstoneams
- Dec 11, 2025
- 7 min read

Let’s make this edition a bit more personal than what is customary. Throughout editions, at times, I offer a personal note as a sliver of an add-on within X piece in order to share additional perspective.
Today, I will offer more personal experience coupled with data that supports various observations of recent years relative to housing.
To begin, in order to give some personal perspective relative to the topic of housing, for various reasons I have been in a position where I play a role across a few different homes, to include a commercial property, and through this, I have had experiences with different households.
Reduced to the bottom line, this means I am essentially responsible for ensuring the properties are in good standing – both in honoring financial terms and in good repair.
As an important add-on, my universe of people, if you will – friends, relatives, friends of friends, etc., - is loaded with tradespeople from masons to electricians to plumbers to carpenters - you get the point. What I hear from them, on any given interaction, is extremely informative.
Through this, when discussing housing, I can experientially chime in more than most want to hear.
Through experience, the housing storyline, in particular over recent years – let’s say 5 years in order to focus on somewhat recent time – has been fascinating and challenging while also being informative of a larger socioeconomic breakdown. We will steer clear of the larger socioeconomic breakdown part and stay solidly within the lane of housing.
Speaking from experience, this includes endless happenstance discussions that have occurred over recent years, to include even recent days, which many times leave me asking myself, “How did this topic, yet again, arise within a conversation completely unrelated to housing?”
The answer became quite obvious as time unfolded; society at large is ever more seriously struggling with housing costs.
Housing costs?
Is that the price of housing itself or all costs related to housing? That would be all costs related to housing, more than housing itself.
This walks us back to our previous edition, where we placed a valuation metric onto home prices (and the stock market) via how many hours of work it takes to purchase the median price of new homes sold relative to average hourly wages. Both measures offer deep history, which in turn offers excellent historical perspective for the valuation metric.
The chart we shared last week is offered again directly below along with annotations added for this week’s edition.
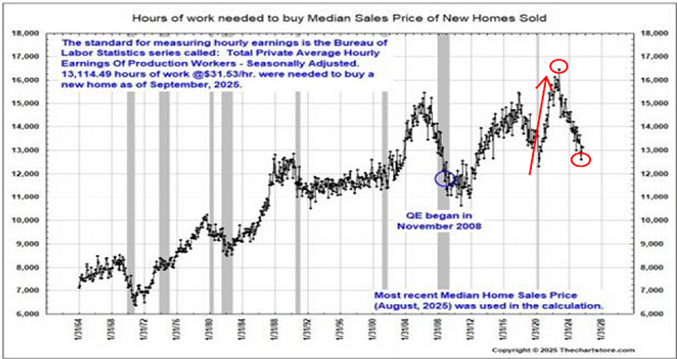
Note the above valuation chart for home prices through an hour’s work measure, which dates back to 1964. This measure places home prices in the context of incomes that pay for them.
Back in early 2020, the government printed money out of thin air and proceeded to fan it about throughout all segments of society in order to save society. It wrecked society.
This should not be a surprise, as money printing in largesse always does. It just feels so good in the moment! The hangover is always the problem, using history as a guide.
Relative to housing prices on the above valuation basis, note the beginning point of our inserted arrow that went vertical. That beginning point was early 2020.
It should not surprise anyone with such a massive distribution of money created out of thin air that asset prices across the board would rise substantially when priced in that devalued currency. So fast that wage growth rates could not possibly keep up with rapidly escalating home prices.
Hence, the above missile launch shows how many hours of work it took to purchase the median sales price of new homes sold. Prices skyrocketed, but worse, far worse, valuation levels went meteoric to the upside.
Prior to the said money printing escapade, the above home price valuation measure was registering general levels consistent with levels experienced dating all the way back to the late 1980s. The cost of carry was even lower!
Our top red circle denotes the high point, which was registering never-before-seen valuation levels for home prices, as the chart depicts.
Take a moment to digest the lower level of the current day, which is highlighted via our second red circle. That is a tremendous drop in the valuation levels of home prices (hours of work valuation measure), which essentially walks us back to the beginning of our red arrow, circa early 2020.
Let’s go back to my experience with housing generally as described at the outset.
Interestingly, and I noted this consistently to myself back then, during the vertical ascent of the above measure via our red arrow, I rarely found myself in happenstance/unsolicited conversations about the challenge of housing prices, even though, on a valuation basis, the prices of homes were mind-boggling, using the above measure as my guide, in real time back then.
More interesting, in the current day, while home prices using the above valuation basis have dropped nearly to levels seen before the money printing blitz spike, the cost of housing’s lack of affordability is seemingly an everyday societal topic. What gives?
The Cost of Carry
The home price itself is a piece of the cost of carrying the home note until it’s paid in full.
If we expand the cost of carry to everything related to “carrying” the home, we begin to see how carrying the home for people back in the valuation peak (above chart, top circle) was much easier (cheaper) than it has been in the years following to the current day.
While valuation levels for the price of homes themselves offer homes are cheaper today, when throwing in all related carrying costs, that statement goes right out the proverbial window.
Electricity costs, heating costs (gas, propane, wood, etc.), interest rates, real estate taxes, and home insurance, along with the costs of repairs and maintenance, to include the labor costs of such or the standalone input material costs if the DIY route is chosen, are all up tremendously from levels experienced just a few years ago.
This says nothing of the lack of quality of replacement products. How many brand-new parts turn out to be faulty given a few weeks of operation, if not a few days?
For my part, I have plenty of such experiences. Underlining this, as I have been writing this edition, I was informed of such a situation. How’s that for timing eh? Through the lens of the aforementioned tradespeople in my universe, such a quality issue is certainly not a rare experience for them.
Continuing, everyone knows interest rate costs are up tremendously. In early 2020 the 15-year average mortgage rate was in the low 2% range, which spiked up to the 7% area only to settle back to the 5 ½% area currently. Bond market participants are showing little enthusiasm toward pushing this rate notably lower. Why?
Price inflation, government budget deficits remaining in place, and massive unfunded liabilities of the government, which assure more downstream Fed money printing, which brings with it more currency instability, which is known as more price inflation. Price inflation is the bane of bond market participants.
This while property insurance growth rates were tame circa early 2020 only to go on their own consistent price spike with each passing year in recent years. Double-digit growth became the norm, as told via the PPI subset of data points for monitoring property insurance and certainly affirmed via my own experience across properties.
Electricity rates went on their own double-digit rise via the CPI’s subset of data drilled down to tracking electricity rates.
On the material cost front for repairs and maintenance, I offer lumber as an item to discuss.
I choose lumber as an input cost because it is supposed to be a successful part of the price inflation story in recent years. Most remember the massive spike in lumber prices following the money printing press blitz back in the early 2020s. Most realize those prices fell back to earth, if you will.
As of the time of this writing lumber prices are quoted at $549 per 1000 board feet on the Chicago Mercantile Exchange. The early 2020 price range was $350 - $400. Split it to $375 which means lumber is currently 46% higher than just a few years ago, and this is after it “came back to earth.”
Underneath the entire housing story is that we have a carrying cost issue when viewed through the lens of the full carrying costs of a home. When viewed through a valuation lens the prices of homes relative to average wages have receded back to early 2020 levels.
When home prices catapulted higher, and along with them valuation levels as depicted in our above chart, most, if not nearly all related home carrying costs were at reasonable levels along with their annual growth rates.
With a little time added, said carrying costs went on their own price-trend type spikes, and through this, pushed the lack of housing affordability toward the top of the list throughout the citizenry.
So while home prices are down notably from their peak using the above valuation measure, the reality of such is swamped over with the massive run in prices related to the carrying costs of a home.
While most view the cost of carry as primarily the interest rate and the cost of the home, in the systemic price inflation environment of recent years, the total cost of carry is what is crippling the everyday household. This holds true for renting a residence or an apartment as well, as that cost of carry has to be carried by somebody in the mix of the property.
To be clear, housing is not low and cheap even when viewed through the above valuation lens.
Rather, when placing price into the above chart’s valuation lens, we can see home prices relative to incomes (using average hourly wage rates) have come down considerably and are nearly back to where they were when the price and valuation spike began in early 2020.
So the next time you hear something about these outrageous home prices, I invite you to consider the much larger storyline related to housing costs as perhaps a larger impediment to something akin to affordable housing.
Home prices, on their own via the valuation perspective as laid out in the above chart, are getting in a reasonable range when viewing our current-day level relative to recent history.
As we often say, price informs little, but valuation tells all.
I wish you well…
Ken Reinhart
Director, Market Research & Portfolio Analysis

Comments