
Fed Survey Corroborates the Quits Ratio which Corroborates Market Participant Pricing
- cornerstoneams
- Sep 10, 2025
- 5 min read

If we do the anatomical thigh bone connected to the hip bone, economics style, we can see, without using any actual employment numbers, that the employment landscape has weakened and continues to do so.
Is it falling apart and crumbling right before our eyes? No.
At this stage there is not corroborating evidence of that type of employment landscape.
For such an employment backdrop to be unfolding before our eyes, we would need to see worsening conditions for those who are currently employed. Think, for example, of escalating weekly unemployment insurance claims as one go-to metric.
What we are seeing, as we had shared in a recent edition when looking at the employment landscape through the Federal Reserve’s dual mandate, is those looking for employment are having an ever more challenging time in securing a position.
Rather than actual numbers, below we will observe human behavior to help in deciphering the general tone of the employment market.
What are people offering through a well-established Fed survey, as well as what are they offering through their own employment market behavior. In addition, what are collective market participants offering via their pricing of two long-standing payroll processors.
The New York Federal Reserve Bank
This week the second district bank of the Federal Reserve System, the New York Fed, released an updated version of their monthly Survey of Consumer Expectations report.
There is a wealth of information within this New York Fed survey covering broad categories such as price inflation, household finance, and labor market surveys.
Speaking to our aforementioned observation that the employment market is not crumbling for those who are employed, we see within this Fed survey, via the Job Separation Expectations (think losing a position involuntarily), that there is little concern of such an outcome.
While these results are off the lows of late 2021 (the timeframe of historical lows for this part of the survey), they remain well contained and well off the high points of the Covid-induced recession of early 2020. Low readings offer little concern of losing a current employment position.
This is not the case when we look at the results for Job Finding Expectations. This category posted the lowest reading dating back to the inception of the New York Fed’s survey. In this case, lower readings offer increased challenges of finding new employment.

The above visual walks us back to mid-2013, which was a time not far removed from the Great Financial Crisis (GFC) of 2008/09.
One of the hallmarks of coming out of that time period was the lack of employment opportunities relative to that of previous post-recession periods. It was a slow crawl out of that period for employment opportunities, in particular relative to other post-recession periods.
The survey results are now posting just under the lows of 2013. To the far right of the chart, we see in recent months a steady and consistent downtrend had begun. This part of the New York Fed’s survey is offering notable challenges by job seekers, and through this, a more challenged general employment landscape.
To Say, “I Quit,” Takes Confidence
The Quits Ratio is always an interesting behavioral view of the employment landscape.
Typically speaking, underneath leaving a job voluntarily, a.k.a., “I quit,” is a level of confidence in employment opportunities.
Over time, we see this displayed in general behavior within the employment landscape as the quits ratio rises as the employment market gets stronger. The inverse is also true in that as the employment landscape gets weaker, the quits ratio turns lower.
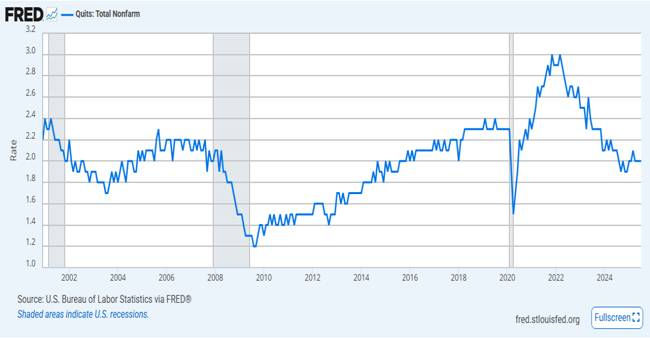
The above is the quits ratio dating back to the beginning of this 21st century.
With the above history, you can view the ebb and flow of confidence in the general employment landscape by the behavior of employment market participants. The shaded horizontal bars depict recession periods for perspective.
From peak confidence in late 2021, we have seen a jagged and yet consistent downtrend in the quits ratio. The far right depicts an attempt at stabilizing, but this can be taken with a grain of salt, as these trends tend to be quite jagged.
What we know is general confidence in the strength of the employment market has waned and continues to do so. This feedback loops to our first chart above, as expectations of finding a job are consistently decreasing.
As a behavioral view, the above offers the tone of the current employment market, which is certainly not red hot, if even solid and strong. Again, those currently employed seem comfortable, while those looking for employment are finding a challenging employment market.
The quits ratio supports this in that those currently employed are not highly confident to the point of jumping ship en masse, as is the case when the employment landscape is rock solid strong.
Let’s not forget the Collective Market Participants’ View
Collective market participants are always forward looking. They price assets today according to what they see, or think they see, downstream on the economic timeline.
In a couple of editions here in 2025, we addressed the payroll processors and how their core business is quite sensitive to the general employment landscape. In those editions we focused on one long-standing processor and how market participants were pricing them in terms of their general trend.
Today we will look at two long-standing processors as compared to the stock market via the S&P 500 index. Our visual approach (below) is set up differently in that it is a 2025 performance chart of the two processors with emphasis on their performance relative to that of the stock market.

The above is a baseline performance chart whereby the performance of the two processors reflects their outperformance or underperformance of the stock market.
Our faint horizontal black line uses the S&P 500 as the baseline, which then allows for the two processors to clearly depict their level of performance relative to that of the S&P index.
The blue line represents Paychex, while the red line depicts Automatic Data Processing. We are using both as tools for this edition. We are not advising a buy or a sell on either of these companies.
The clear messaging from market participants relative to these two payroll processing companies was tremendous outperformance compared to that of the stock market. This held true for the bulk of 2025 until mid-to-late June.
Our red downtrend line highlights the notable change in how collective market participants began viewing and pricing these two payroll processors.
In a nutshell, they went from being tremendous outperformers to notable underperformers in just over three months. That level of change in participant messaging is certainly worthy of attention. They seem to be offering increased concerns for the employment landscape via their pricing of these two processors.
In total the employment market can be described as bifurcated. Those currently employed are offering little concern about losing their position. Those looking for employment are finding a challenging landscape.
Will this descend into a trend where the employment market weakens further? That is the question, which is why, for our part, we are focused on so many aspects of the socioeconomic landscape.
The Fed is expected to cut rates next week.
Will the bond market agree with them and also cut rates on longer-dated maturities within the treasury bond market?
For our part, that is the central question because if the Fed cuts but finds the bond market fully disagrees with them, then that will offer bad news around the economic spectrum, to include the employment market.
We are now barreling toward the last quarter of 2025. It should prove to be very interesting across the markets and economic spectrum.
I wish you well…
Ken Reinhart
Director of Market Research and Analysis


Comments